|
Disc Spring Solver allows you to create a lot of different plots concerning disc springs performances and characteristics, not only for the single disc spring but also for the spring stack.
Below it is shown a series of plots for common sized disc springs:
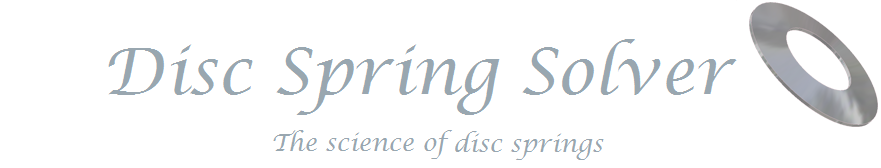
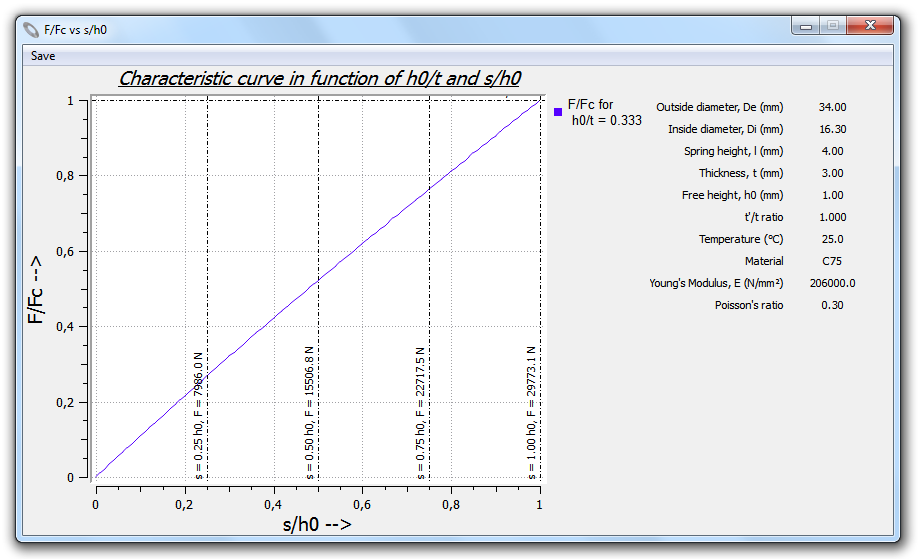
Characteristic curve: it characterizes every disc spring by showing the F/Fc (Load/Flat load) ratio's trend depending by the s/h0 (deflection/free height) ratio for a given h0/t (free height/thickness) ratio.
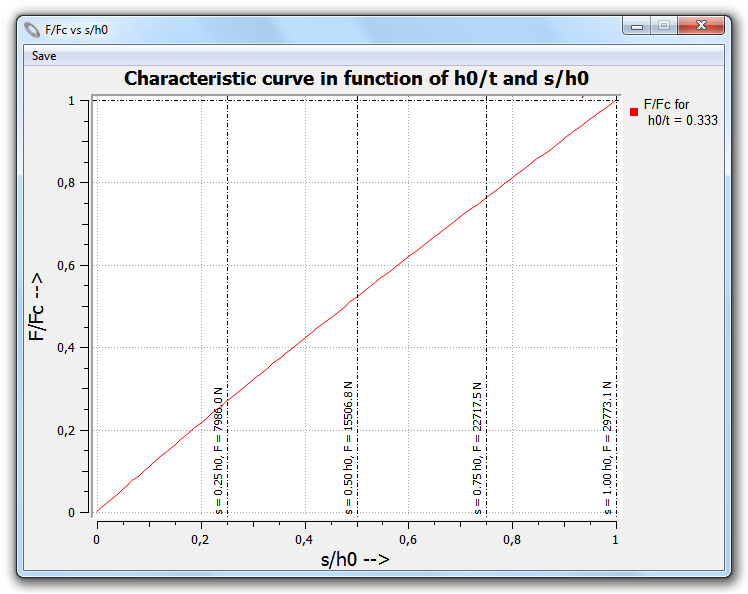
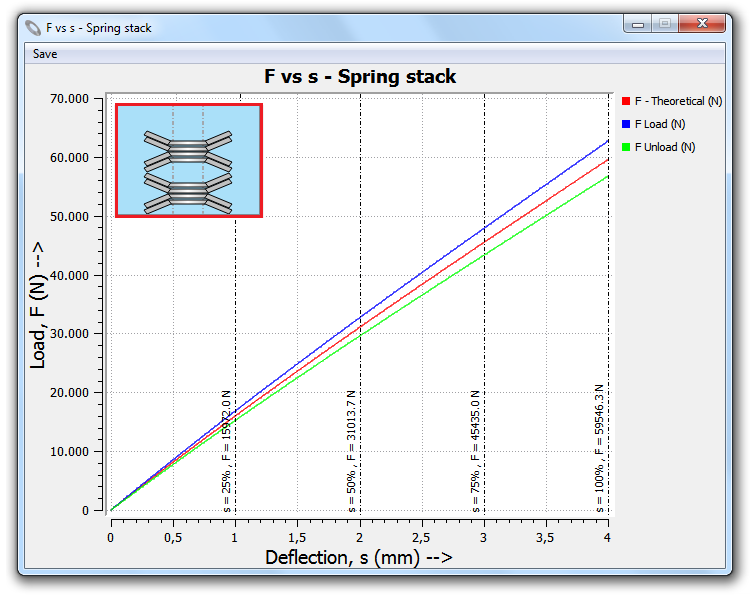
F vs s: Disc Spring Solver allows you to see the load's, F, trend for a given deflection s, both for the single disc spring and for the designed spring stack, below two plots concerning two different stacks are shown, the first stack has the same number of disc springs for every packet while in the second stack the disc spring number for packet changes.
Disc Spring Solver is at today the only software on the market that allows you to create this kind of spring stacks which have an increasing characteristic F vs s curve and to visualize their behaviours and characteristics.
Every plots show both the theoretical load trend and the trend of the load obtained during the loading and the unloading phase. The last two quantities are calculated using standard values of the involved friction coefficients. For more details please look at the software help file.
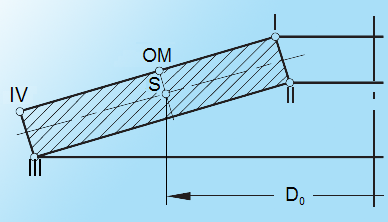
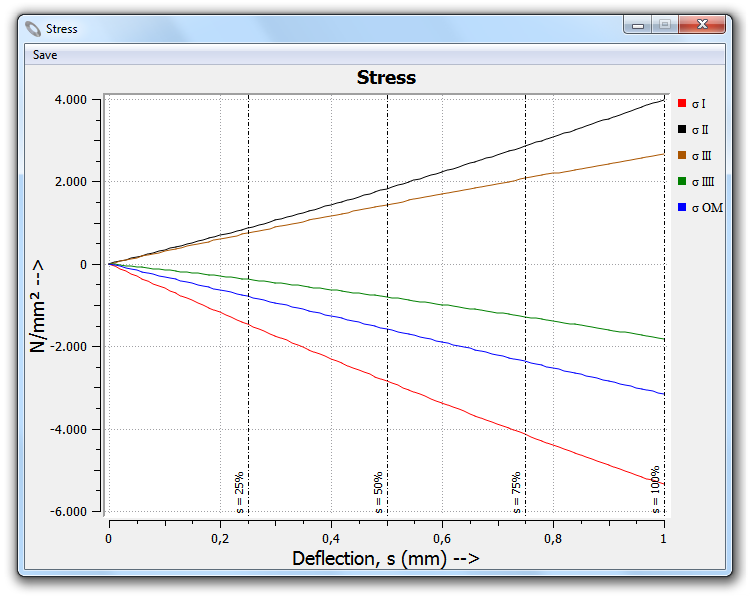
Stress curve: It shows the value of the stress (positive if tractions, negative if compressions) suffered by the spring in five characteristic points.
In the shown plot a complete spring squashing is considered.
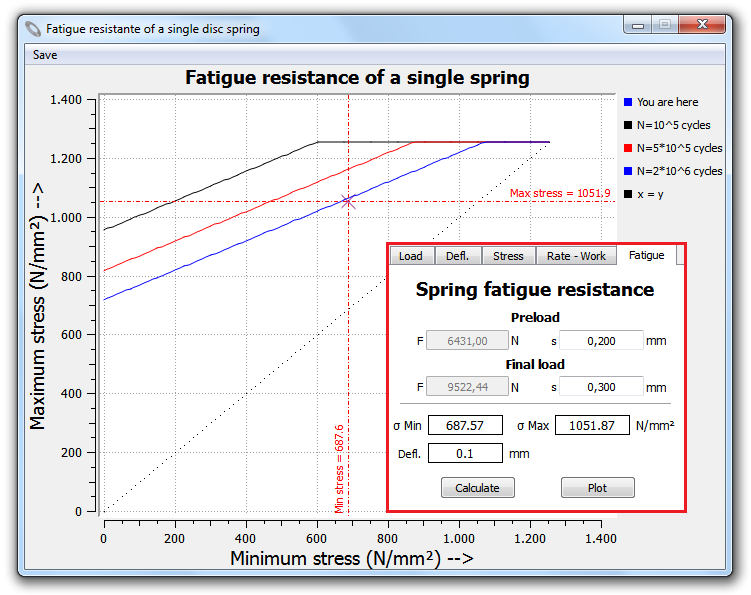
Fatigue resistance: Disc Spring Solver allows you to see a Goodmann diagram that can help you in evaluating the designed spring's fatigue resistance, depending by the spring characteristics one of the three available diagrams is shown.
It is to say that the values of the diagrams are valid for single springs and spring stacks up to 10 single springs stacked in series, operating at room temperature with hardened and perfectly finished inner or outer guides and minimum preload deflection s = 0.15 - 0.20 h0 (height - thickness).
Customization: Every plot is fully customizable by the menu item "Plots - Options" that, in addition to the possibility of changing colors and fonts of the plot, allows you to show the spring's data on the plot's screen.
This site is © Copyright 2022 SpringSolver. All Rights Reserved.
|